Category: Semiconductors

Korean chipmakers and the equipment, materials and parts suppliers behind them, explained from their regulatory filings.

  • Wonik IPS: The Korean Deposition Equipment Maker Behind Chip Fabs

    Wonik IPS: The Korean Deposition Equipment Maker Behind Chip Fabs

    Every memory chip is built up from extremely thin layers of material laid down on a silicon wafer. Wonik IPS makes the machines that lay down those layers. Its customers are chipmakers, and it also sells equipment to display and solar cell factories.

    The company is listed on KOSDAQ, the Korean exchange’s market for growth and technology companies, which is separate from the main KOSPI board. Its ticker is 240810.

    Its name often comes up in Korean coverage of Samsung Electronics’ earnings. This article explains what the company sells, who buys it, how large its FY2025 business was, and why a strong quarter at a chipmaker does not turn straight into equipment sales.

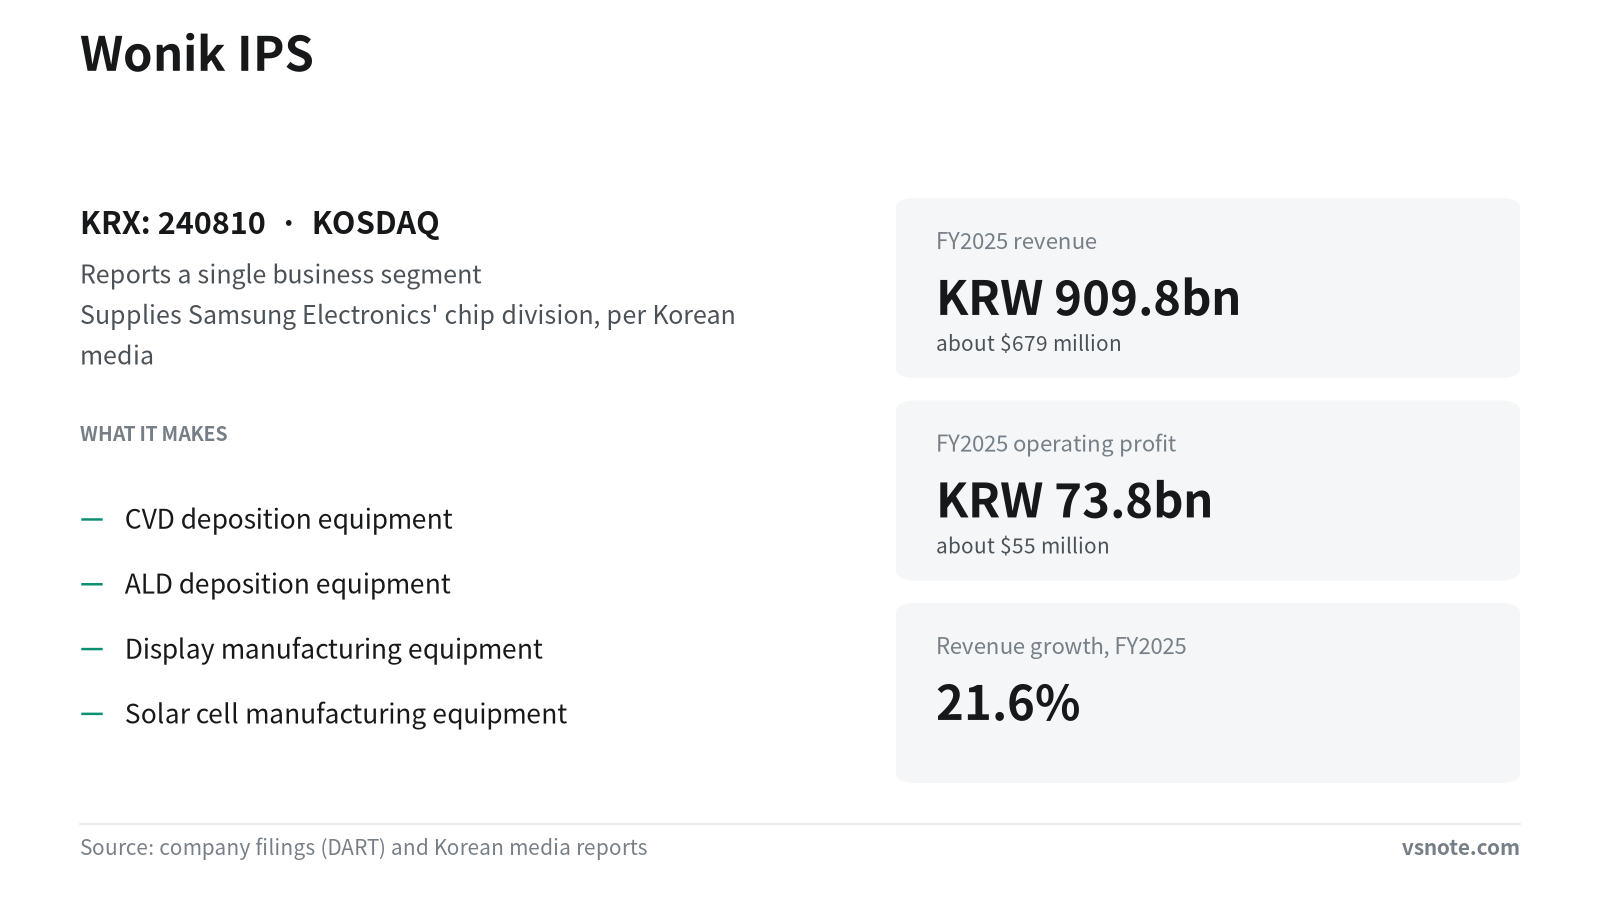
    WONIK IPS CO., LTD. (원익아이피에스) · KRX: 240810 · KOSDAQ

    Won amounts are converted at ₩1,339.2 per US dollar (Bank of Korea ECOS, KRW/USD base rate, 2026-10-08) for scale only.


    What its machines do inside a chip plant

    Wonik IPS makes and sells core manufacturing equipment for semiconductors, displays and solar cells. Its main field is semiconductor deposition, which means building a circuit layer by settling material onto a wafer surface one very thin film at a time.

    Think of deposition as putting very thin coats of paint on a wall, again and again. Wonik IPS does not sell the paint. It sells the machine that applies the coats.

    The comparison only goes so far. Real deposition does not involve brushing on a liquid. Gas settles onto the surface inside a vacuum chamber, building films only a few atoms thick. A single chip also contains many films of different materials, stacked over and over.

    Its core products are CVD and ALD equipment. CVD (chemical vapour deposition) forms a film when gases react on the wafer. ALD (atomic layer deposition) builds the film one atomic layer at a time, which gives finer control over thickness.

    • Semiconductor manufacturing equipment, mainly deposition (CVD, ALD)
    • Display manufacturing equipment
    • Solar cell manufacturing equipment

    Where it sits in the chipmaking chain

    Chipmaking runs in stages. Materials suppliers provide wafers, gases and chemicals. Equipment makers build the machines that process them. Chipmakers run those machines in their fabs to make chips, and the chips end up in servers, phones and other devices.
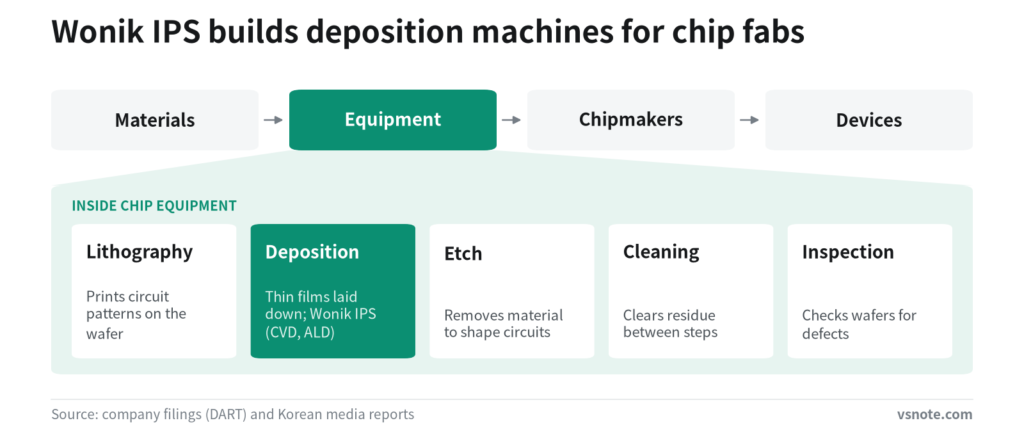
    Industry map running from materials suppliers to equipment makers, chipmakers and end devices, with the equipment stage highlighted and opened up to show that Wonik IPS works in deposition.

    Wonik IPS works at the equipment stage, specifically deposition. According to Korean media reports, it supplies equipment to the semiconductor division of Samsung Electronics, known as Device Solutions (DS).

    In Korean financial media, companies like this are grouped as “sobujang”, a short form for materials, parts and equipment suppliers to manufacturers. That is the label the company usually carries in Samsung-related news.

    The company’s annual report says US, Japanese and Dutch companies hold high shares of the global semiconductor equipment market. The same report describes Wonik IPS as one of the Korean equipment makers that have localised key semiconductor equipment, meaning they produce in Korea machines that chipmakers used to import. It adds that Korea’s localisation rate for chip equipment is gradually rising.

    The filings and reports cited here give no market share figures for Wonik IPS or its competitors in deposition equipment.


    Reading the numbers of a company that mostly sells machines

    The figures below come from the company’s annual report, filed on DART, the electronic disclosure system run by Korea’s Financial Supervisory Service. Korean companies number their fiscal years from incorporation. For Wonik IPS, the 10th fiscal period is FY2025 and the 9th is FY2024. All figures are consolidated, meaning the parent company and its subsidiaries are combined, as opposed to the separate (standalone) figures for the parent alone.

    Consolidated revenue for FY2025 was KRW 909.8 billion (about $679 million), up 21.6% from KRW 748.2 billion (about $559 million) in FY2024.

    Operating profit rose from KRW 10.6 billion (about $8 million) in FY2024 to KRW 73.8 billion (about $55 million) in FY2025. Net profit rose from KRW 20.7 billion (about $15 million) to KRW 84.0 billion (about $63 million).
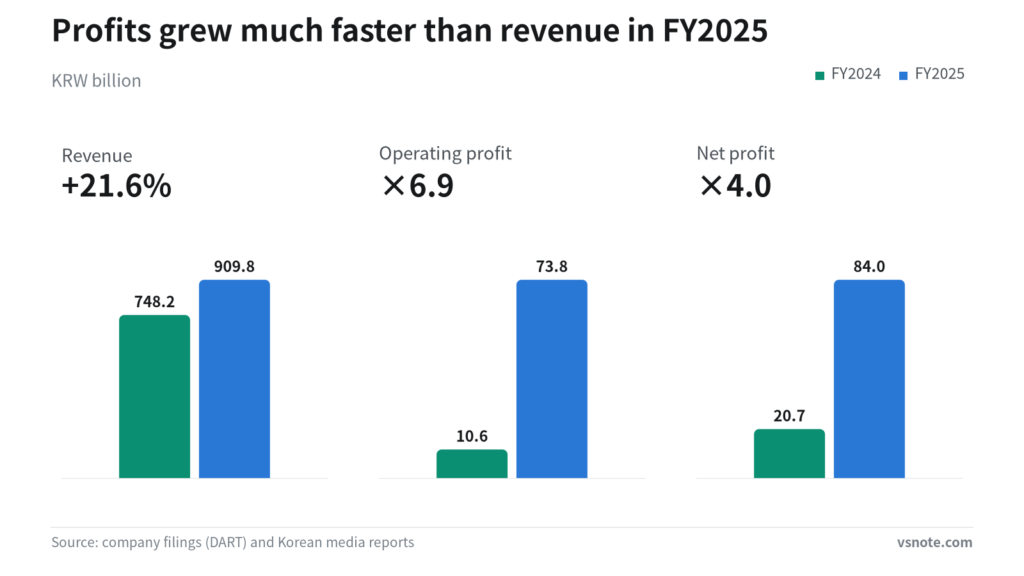
    Grouped bar chart comparing Wonik IPS's consolidated revenue, operating profit and net profit in FY2024 and FY2025.

    Net profit was larger than operating profit in FY2025. The filing excerpts cited here do not explain why.

    Product sales, meaning machines the company builds itself, were KRW 786.6 billion (about $587 million) in FY2025, or 86.5% of revenue. The rest, KRW 123.2 billion (about $92 million), came from goods and services: items bought in and resold, plus work such as servicing installed equipment.

    Because most revenue comes from selling machines, these numbers depend on customers deciding to buy equipment. When chipmakers add capacity, product sales rise. When they hold back, product sales fall.

    The company reports a single business segment. It says that because it makes all its products at the same limited sites with the same equipment and staff, its business cannot easily be split. As a result, outsiders cannot see how much revenue comes from semiconductors, displays or solar cells.


    Does a big Samsung quarter mean more machine orders?

    The company’s annual report says the semiconductor equipment industry moves with the growth of its downstream market, the chip industry. So a link to Samsung exists, but it is indirect.

    According to Korean media reports, Samsung Electronics announced preliminary results for the third quarter of 2026 on 8 October 2026, with operating profit of KRW 107.40 trillion (about $80.20 billion). The reports describe this as the first time a Korean company’s quarterly operating profit went above KRW 100.00 trillion (about $74.67 billion).

    The same reports say the semiconductor division drove the result. The main reason cited was higher DRAM and NAND flash prices as demand for AI servers grew. The reports also say Samsung’s sales of HBM4 for Nvidia’s Vera Rubin platform start to show up from that quarter. HBM (high-bandwidth memory) is stacked DRAM placed next to AI processors to feed them data quickly.

    Profit earned from higher chip prices does not become an equipment order by itself. In between, the chipmaker has to decide to expand or upgrade its fabs, the moment in the paint analogy when the owner decides to paint a new room.
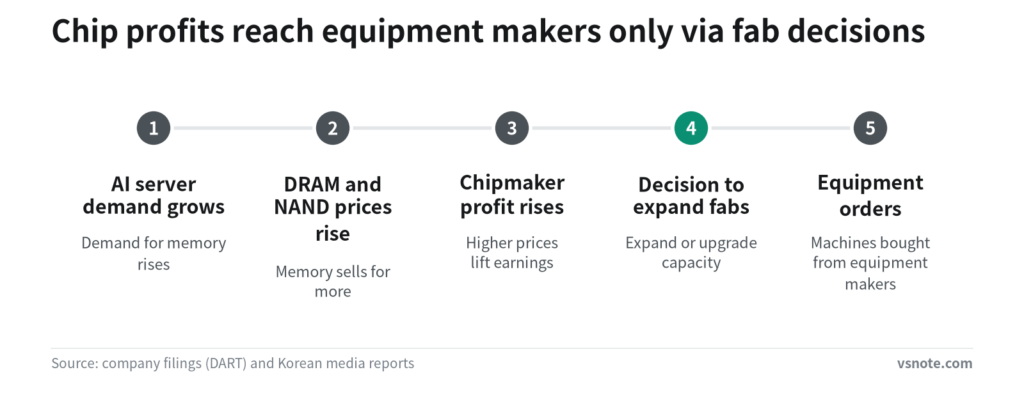
    Five-step chain from AI server demand to higher memory prices, chipmaker profit, a decision to expand or upgrade fabs, and finally equipment orders, with the expansion decision highlighted.

    The filings and reports cited here do not show Wonik IPS’s order backlog, its revenue by customer, or any Samsung decision to expand capacity. Those are the facts to look for in the next round of news about Samsung’s capital spending.


    Frequently asked questions

    Q. What does Wonik IPS actually make?

    A. Manufacturing equipment for semiconductors, displays and solar cells. Its main products are deposition machines, specifically CVD and ALD equipment, which lay thin films of material onto wafers.

    Q. Is Wonik IPS a Samsung supplier?

    A. According to Korean media reports, it supplies equipment to Samsung Electronics’ semiconductor (DS) division. The filings cited here do not show what share of its revenue comes from Samsung.

    Q. How large was the business in FY2025?

    A. The company’s annual report shows FY2025 consolidated revenue of KRW 909.8 billion (about $679 million), up 21.6% from the prior year, and operating profit of KRW 73.8 billion (about $55 million). Products the company builds itself made up 86.5% of revenue.

    Q. Why can’t I see revenue split between chips, displays and solar?

    A. The company reports one business segment. It says its products are made at the same sites with the same equipment and staff, so it does not split them.

    Q. Where are the company’s filings?

    A. On DART, Korea’s electronic disclosure system run by the Financial Supervisory Service. Annual reports use fiscal period numbers: for this company, the 10th period is FY2025.


    Sources

    • https://dart.fss.or.kr/dsaf001/main.do?rcpNo=20260316001453
    • https://blog.naver.com/kodlandman2026/224434886191
    • https://blog.naver.com/sorak0131/224434918891
    • https://blog.naver.com/jicprid/224432676426
    • https://blog.naver.com/jsc415/224435472234

    This article explains company filings and published figures for information only. It is not investment advice or a recommendation to buy or sell any security. Figures can change after publication — check the original filings before making decisions.
  • Jusung Engineering sells the machines that make chips, not chips

    Jusung Engineering sells the machines that make chips, not chips

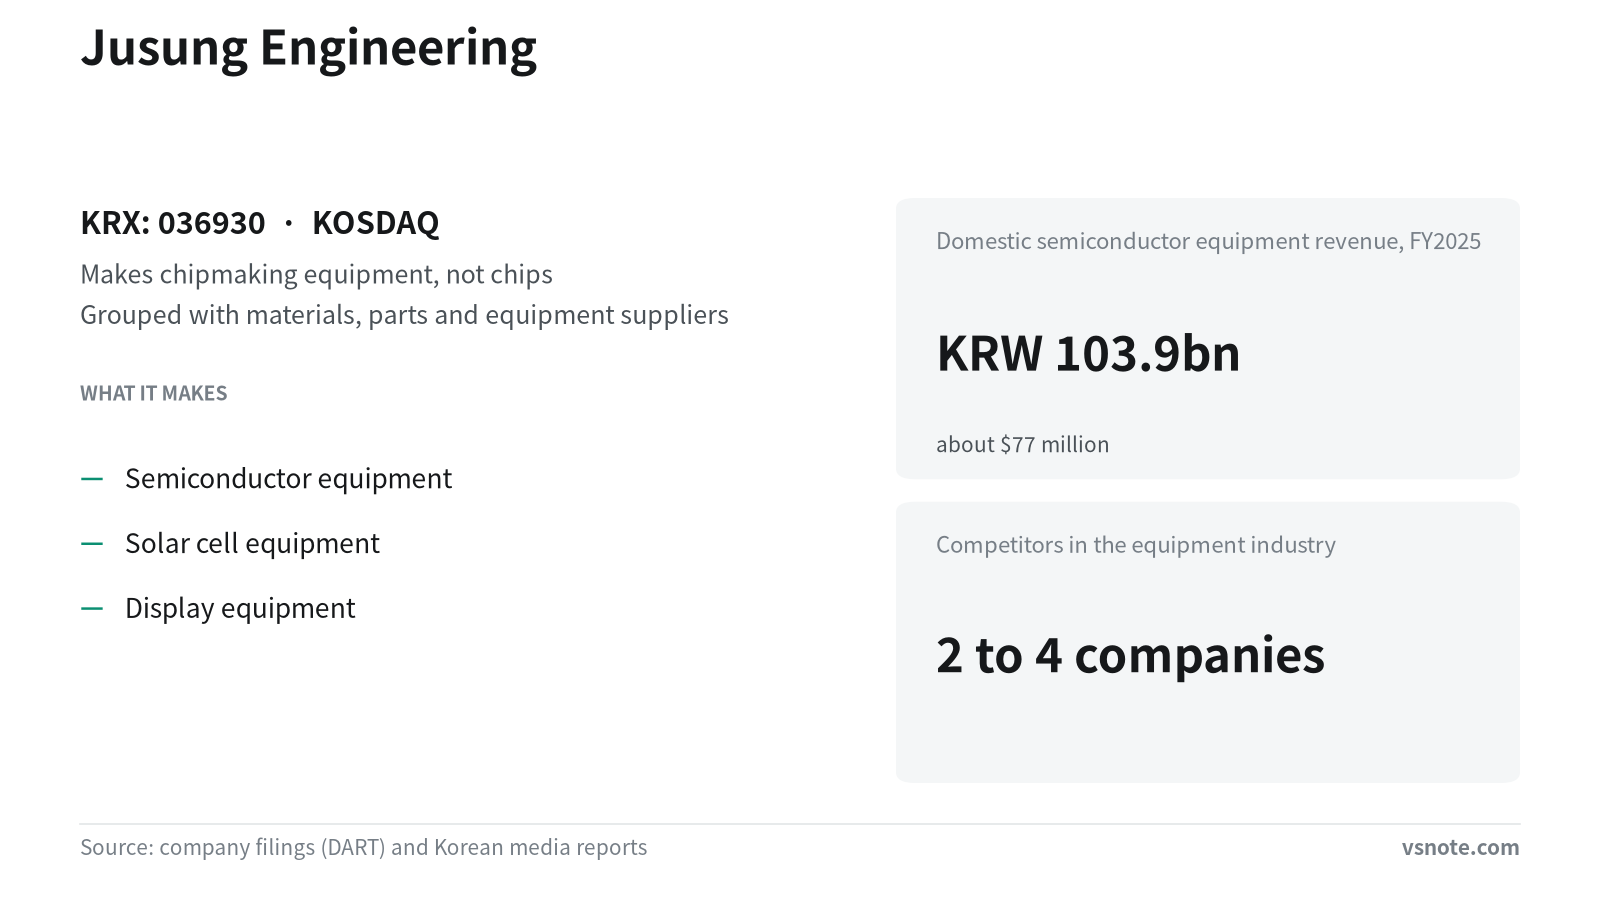
    Jusung Engineering’s name comes up in Korean market wrap-ups next to other semiconductor stocks. That does not mean its chips are inside your phone. The company does not make chips.

    It makes the machines that chipmakers use to produce them. The company trades on KOSDAQ, ticker 036930. KOSDAQ is the Korea Exchange’s market for growth and technology companies, and KOSPI is its main board.

    That one difference explains most of what follows, including why its revenue can swing sharply from one year to the next.

    JUSUNG ENGINEERING Co.,Ltd. (주성엔지니어링) · KRX: 036930 · KOSDAQ

    Won amounts are converted at ₩1,345.3 per US dollar (Bank of Korea ECOS, KRW/USD base rate, 2026-09-15) for scale only.


    Chips, or the machines that make chips

    Think of a bakery. One business bakes and sells bread. A different business supplies its ovens and mixers. Jusung Engineering is the second kind.

    The company’s annual report describes a business in semiconductor and solar cell manufacturing equipment. It reports three segments: semiconductor equipment, solar cell equipment and display equipment.

    Its core product is deposition equipment. Deposition means laying down a film, too thin to see, on the wafer that will become chips.

    So the company earns money when a chipmaker installs new equipment in a factory, not when chips are sold. A bakery that sells a lot of bread still does not buy a new oven every month.

    In Korea the company is grouped with materials, parts and equipment suppliers. These are companies whose products go into making finished goods rather than being finished goods themselves.


    Where the machine sits in the supply chain

    The next question is usually where the company ranks in its field. The sources cited here include no market share figure for the company, so this article uses three other measures: who buys the equipment, what it takes to sell it, and how large the company is.

    • Buyers are device makers, the companies that manufacture chips and run the factories. Consumers do not buy this equipment.
    • The equipment has to be developed to fit each buyer’s system. The annual report lists this as one of the competitive factors for entering the semiconductor market.
    • On size, Korean media reports place the company among the largest KOSDAQ stocks by market value, and some put it in the top 10.

    Built to the buyer’s specification

    This is where the bakery analogy stops working. An oven can be picked from a catalogue, but this equipment has to be designed around the buyer’s own production process.

    The seller does not build machines ahead of time and wait for orders. It builds them to conditions the buyer sets.

    That requirement also explains the next point: not every company can make this equipment and sell it.


    Why only a few companies make the same equipment

    This number comes from the company, not from an outside count. Its annual report says competition in the semiconductor equipment industry narrows down to two to four companies.

    The same report gives three competitive factors for entering the semiconductor market:

    • Developing equipment that fits the device maker’s system
    • Sustained investment in research and development
    • A range of products broad enough to cope with the business cycle

    Domestic sales tripled while total revenue fell

    Korean filings number fiscal years in sequence. For this company, the 30th fiscal period is FY2024 and the 31st is FY2025. The annual reports covering both were filed in March 2026 on DART, Korea’s electronic disclosure system run by the Financial Supervisory Service.

    The annual report splits semiconductor equipment revenue into domestic and export sales, and reading one without the other gives the opposite impression.

    • Domestic — KRW 34.2 billion (about $25 million) in FY2023, KRW 44.2 billion (about $33 million) in FY2024, KRW 103.9 billion (about $77 million) in FY2025
    • Export — KRW 180.6 billion (about $134 million), then KRW 305.5 billion (about $227 million), then KRW 199.8 billion (about $149 million)
    • Total — KRW 214.8 billion (about $160 million), then KRW 349.7 billion (about $260 million), then KRW 303.7 billion (about $226 million)

    Domestic sales more than doubled in the latest year and are about three times what they were two years earlier. Total semiconductor equipment revenue fell over the same year, because exports gave back more than the domestic gain added. The figures are consolidated, meaning they include subsidiaries, not separate (standalone) figures for the parent company alone.

    Both movements come from how the business works rather than from a one-off event. When equipment is built to each buyer’s process, sales bunch up in the years a customer adds capacity and thin out in the years it does not — and customers in different places add capacity at different times.

    So neither figure is a trend on its own. A doubling does not mean the company doubles every year, and a lower total does not by itself mean decline. One period’s figure describes that period.

    These figures also leave something out: solar cell and display equipment are counted separately.


    Where demand for new equipment comes from

    If revenue arrives when customers install equipment, the open question is whether customers will keep installing it. The sources cited here contain no research firm estimate of this market’s size or growth, so this article reports none.

    What the annual report does give is the company’s own description of the industry. It calls semiconductors a technology-intensive industry with a short product life cycle, used in advanced fields such as artificial intelligence, quantum computing, fintech, autonomous vehicles and humanoid robots.

    The report also calls it a high-value-added industry with large spillover effects on core industries such as electronics, information and communications, machinery and automobiles.

    The short life cycle matters most here. When the products change, the processes that make them have to change too, and that is when manufacturers buy new equipment. The filings cited here do not show how large that demand will be or when it will come.


    Frequently asked questions

    Q. Does Jusung Engineering make chips?

    A. No. It makes the equipment used to manufacture semiconductors, solar cells and displays. Its buyers are chip manufacturers that run factories, not consumers.

    Q. Who are Jusung Engineering’s competitors?

    A. The annual report says competition in the semiconductor equipment industry narrows down to two to four companies. The filings cited here do not name them.

    Q. Domestic revenue more than doubled. Does that mean steady growth?

    A. Domestic semiconductor equipment revenue rose to KRW 103.9 billion (about $77 million) in FY2025 from KRW 44.2 billion (about $33 million) in FY2024. Total semiconductor equipment revenue fell over the same year, from KRW 349.7 billion (about $260 million) to KRW 303.7 billion (about $226 million), because export sales fell. The equipment is built for each customer’s process, so sales depend on when customers invest in new capacity — and customers in different places invest at different times. A single period’s figure should not be read as a trend.

    Q. What do the 30th and 31st fiscal periods mean in the filings?

    A. Korean filings number fiscal years in sequence. For this company, the 30th period is FY2024 and the 31st is FY2025. The annual reports are available on DART, Korea’s electronic disclosure system run by the Financial Supervisory Service.

    Q. Is there a forecast for the market this company sells into?

    A. The sources cited here include no research firm estimate of the market’s size or growth. The annual report describes semiconductors as a technology-intensive industry with a short product life cycle, used in fields such as artificial intelligence, autonomous vehicles and humanoid robots.


    Sources

    • https://dart.fss.or.kr/dsaf001/main.do?rcpNo=20260318000323
    • http://www.choicenews.co.kr/news/articleView.html?idxno=170819
    • http://www.inews24.com/view/2000699
    • https://www.news2day.co.kr/article/20260901500211
    • https://www.namdonews.com/news/articleView.html?idxno=921905

    This article explains company filings and published figures for information only. It is not investment advice or a recommendation to buy or sell any security. Figures can change after publication — check the original filings before making decisions.

  • How HANMI Semiconductor books revenue, and why headlines clash

    How HANMI Semiconductor books revenue, and why headlines clash

    The same company, the same six months, and two headlines that read like opposites: a record quarter, and a half-year that shrank.

    Both are accurate.

    HANMI Semiconductor CO., LTD. records revenue not on the day a machine is built, but on the day the customer receives it and accepts it.

    A card summarising the company's founding, listing, product lines and headline FY2025 consolidated figures.

    HANMI Semiconductor CO., LTD. (한미반도체) · KRX: 042700 · KOSPI

    Won amounts are converted at ₩1,337.9 per US dollar (Bank of Korea ECOS, KRW/USD base rate, 2026-09-10) for scale only.


    The machine that presses stacked DRAM together

    Finished DRAM dies are stacked one on top of another, and then heat and pressure are applied at the same time to press them into a single block.

    A left-to-right chain of HBM production stages, with the heat-and-pressure bonding stage highlighted as the step the company's TC bonder performs.

    Memory built that way is called HBM — DRAM stacked upward to raise the speed at which data moves.

    The machine that does the pressing is a TC bonder, short for thermocompression bonder, and that is what HANMI Semiconductor makes.

    The company was founded in 1980 and builds back-end semiconductor equipment. Back-end is the later stage that cuts, attaches and inspects finished chips into a form that can actually be used.

    It also makes equipment that cuts, cleans, inspects and moves semiconductor packages, and die bonders that attach chips to substrates.

    The shares trade on the KOSPI, the main board of the Korea Exchange, under ticker 042700. (KOSDAQ is the separate, smaller-company board.)

    So what this company sells is not something a consumer buys. It is capital equipment that a chip plant installs on its line — no shelf space, no advertising.

    That changes where the money starts. Revenue here does not begin when people buy something; it begins on the day a chip maker decides to add line capacity.

    Which leaves one question: when does that decision land on this company’s books?


    When money actually lands on the books

    Picture a workshop that builds furniture to order. While it spends four months on a single wardrobe, its bank balance sits at zero, and on the day the piece is delivered and the customer says it is fine, the whole payment arrives at once.

    A four-step process from order to booked revenue, highlighting customer acceptance as the point where the sale is recorded.

    HANMI Semiconductor is built the same way. It takes an order, designs and builds the equipment, and records a sale when the customer receives that equipment and accepts it.

    The point is the timing: revenue is booked on the day the machine is handed over, not the day it was made.

    While equipment is being designed and built, however busy the floor is, nothing shows up as revenue. The moment the customer accepts it, the entire value drops into one quarter. Swings between quarters are therefore not a company alternating between good and bad three-month stretches — they are a question of which column the acceptance date fell into.

    Which produces results like this. According to Korean media reports, first-quarter 2026 revenue was KRW 50.9 billion (about $38 million) and operating profit KRW 8.5 billion (about $6 million).

    The very next quarter, reported second-quarter 2026 revenue was KRW 251.2 billion (about $188 million).

    Did the company become five times larger in three months? Reported cumulative revenue for the first half of 2026 was KRW 302.1 billion (about $226 million), which spread evenly over two quarters works out to about KRW 151.0 billion (about $113 million) each. Both quarters are that figure pushed forward or backward.

    The company did not suddenly perform five times better in the second quarter. The month it handed the machines over happened to fall in the second quarter.

    The workshop analogy breaks down at one point. A workshop has dozens of customers whose acceptance dates scatter, which smooths its account.

    Here, a single machine carries a large price and the buyers are few, so one customer’s line-expansion schedule can move an entire quarter. There are simply not many customers for the timing to spread across.


    Why the record story and the decline story run together

    Once that structure is in hand, the contradiction resolves.

    Two bars comparing reported first- and second-quarter 2026 revenue, with the second quarter emphasised.

    According to Korean media reports, consolidated second-quarter 2026 revenue was KRW 251.2 billion (about $188 million) and operating profit was KRW 130.3 billion (about $97 million). Consolidated means the parent and its subsidiaries combined, as opposed to separate — standalone — figures for the parent alone.

    Against the same quarter a year earlier, revenue was up 39.5% and operating profit up 51.0%, and it was the largest quarterly revenue since the company was founded. Operating margin for the quarter was 51.90%.

    Group the same year into a half and the picture inverts. Cumulative first-half revenue of KRW 302.1 billion (about $226 million) and operating profit of KRW 138.8 billion (about $104 million) were, on the same reported basis, 7.7% and 11.0} lower than a year earlier.

    The record figure measures three months. The decline measures six. The first quarter goes into the half-year column but not into the quarterly one, so two opposite headlines about the same six months are true at the same time.

    Both stories are right. They differ only in where the ruler is laid down — cut to three months it is a record, stretched to six it is a decline.

    Which column the acceptance date fell into is what makes that difference.


    Revenue up, operating profit down, net income up

    The sections above were about where you cut the period. There is a second kind of mismatch, of a different type.

    Grouped bars comparing revenue, operating profit and net income for FY2025 against the prior fiscal year on a consolidated basis.

    Stretch the window to a full year and revenue and profit still do not move together.

    Korean filings number fiscal years from a company’s founding, so the 46th fiscal period is FY2025; the annual report for it was filed on 2026-03-12.

    The annual report shows consolidated revenue rising from KRW 558.9 billion (about $418 million) to KRW 576.7 billion (about $431 million).

    Operating profit went the other way, from KRW 255.4 billion (about $191 million) to KRW 251.4 billion (about $188 million), while net income rose from KRW 152.6 billion (about $114 million) to KRW 214.0 billion (about $160 million). Total assets moved from KRW 710.9 billion (about $531 million) to KRW 813.3 billion (about $608 million).

    When a headline pairs this company’s name with a number, the first thing to establish is which line of that table the number came from. Read only the revenue line and it was a better year; read only the operating profit line and it was a worse one — and both are disclosed figures from the same fiscal period.

    Expressed as operating profit per 100 of revenue, the prior year works out to 45.7 and FY2025 to 43.6. Sales grew, and what was left per 100 sold fell by a little over two.

    This company already has a year on record where revenue, operating profit and net income each pointed in a different direction. Pick whichever of the three lines you prefer, and you can write opposite stories about the same twelve months.


    Where the next machine appears before the news does

    The three sections above all end in the same place: the past results table alone will mislead you. Which leaves one question — where should you look instead?

    What happens next is written into disclosures before it reaches the news.

    According to Korean media reports, the company received an order worth KRW 44.2 billion (about $33 million) from SK hynix for TC bonders for HBM4, and that order is described as investment to expand HBM4 production capacity. The same reports say the company is carrying out an eighth-plant investment of KRW 130.0 billion (about $97 million).

    How large is KRW 44.2 billion (about $33 million) for this company? Set against FY2025 consolidated revenue, it is roughly 7.7% — about one thirteenth of a year’s revenue captured in a single contract.

    Filings themselves are received by DART, Korea’s electronic disclosure system, run by the Financial Supervisory Service. Anyone can search it by company name.

    The company’s own filings include the following.

    • Order-related disclosures — what was sold, and for how much.
    • A decision to acquire tangible assets — where you see whether production capacity is being added; the company’s filing was received on 2026-08-18.
    • A notice of an investor relations presentation — what the company intends to explain, received on 2026-08-19.
    • Voluntary disclosures, including a corporate value-up plan and other management matters — filings the company made without being required to.
    • A report of holdings in the company’s securities by Kwak Dong-shin, filed as an officer and major shareholder.

    Which ruler to hold against these numbers

    To put it together: this company’s quarterly numbers jump around not because it alternates between doing well and doing badly every three months, but because the full price of a machine lands in the period the customer takes delivery.

    That is how a record quarter and a first half down 7.7% can both be true of the same six months, and how a fiscal year can show revenue up, operating profit down and net income up again.

    These figures are closer to a delivery-and-acceptance schedule than to a report card.

    So the first thing to check in any article about this company is not the size of the number but how many months it measures — a quarter, a half, or a year — and which line it refers to: revenue, operating profit, or net income.

    Attach those two things to the number and most of the headlines that sounded contradictory line up.

    What is public stops here: results through the second quarter of 2026, the August filings on the tangible-asset acquisition and the investor relations presentation, and the reported KRW 44.2 billion (about $33 million) order and KRW 130.0 billion (about $97 million) eighth-plant investment.

    When that equipment is handed to the customer, and which quarter’s revenue it becomes, the filings cited here do not show. There is no way to establish it except to wait and check the disclosure.

    Going a step further and saying what comes next is not something this article can do — the arithmetic is here, and the judgment belongs to the reader.


    Frequently asked questions

    Q. What does HANMI Semiconductor actually make?

    A. It makes back-end semiconductor equipment. That includes TC bonders, which stack several DRAM dies and press them together with heat and pressure to build HBM; equipment that cuts, cleans, inspects and moves semiconductor packages; and die bonders that attach chips to substrates. The company was founded in 1980, and it sells equipment that chip plants install rather than anything a consumer buys.

    Q. What exactly does a TC bonder do?

    A. TC bonder is short for thermocompression bonder. Building HBM requires stacking several DRAM dies upward, and this machine applies heat and pressure together to press those chips into one piece. Think of it as the machine at the end of the stacking process that turns the stack into a single unit.

    Q. Revenue went from KRW 50.9 billion (about $38 million) in the first quarter of 2026 to KRW 251.2 billion (about $188 million) in the second. Did the company get five times bigger?

    A. No. The company records revenue at the point the customer receives and accepts the equipment, so quarterly revenue can diverge sharply depending on which quarter the acceptance month falls in. On reported figures, cumulative revenue for the first half of 2026 was KRW 302.1 billion (about $226 million), which divided across the two quarters is about KRW 151.0 billion (about $113 million) each.

    Q. I have seen both ‘record high’ and ‘down year on year.’ Which one is correct?

    A. Both. Taken on its own, the second quarter of 2026 was, according to Korean media reports, the company’s largest quarterly revenue since founding and up 39.5% from the same quarter a year earlier. Bundle the same year into six months and cumulative first-half revenue was 7.7% lower than a year earlier. The only difference is where the period is cut.

    Q. Doesn’t profit rise when revenue rises?

    A. Not necessarily. The annual report for FY2025 shows consolidated revenue rising from KRW 558.9 billion (about $418 million) to KRW 576.7 billion (about $431 million) while operating profit fell from KRW 255.4 billion (about $191 million) to KRW 251.4 billion (about $188 million), and net income rose from KRW 152.6 billion (about $114 million) to KRW 214.0 billion (about $160 million). The three lines pointed in different directions in the same year.

    Q. Where can I read the original filings rather than a summary?

    A. DART, Korea’s electronic disclosure system run by the Financial Supervisory Service, lets anyone search filings as received by entering the company name. Relevant document types include order-related disclosures, decisions to acquire tangible assets, notices of investor relations presentations, and voluntary disclosures. For this company, the tangible-asset acquisition decision was received on 2026-08-18 and the investor relations notice on 2026-08-19.


    Sources

    • https://dart.fss.or.kr/dsaf001/main.do?rcpNo=20260312001230
    • https://dart.fss.or.kr/dsaf001/main.do?rcpNo=20260819800096
    • https://dart.fss.or.kr/dsaf001/main.do?rcpNo=20260819800093
    • https://dart.fss.or.kr/dsaf001/main.do?rcpNo=20260818800167
    • https://dart.fss.or.kr/dsaf001/main.do?rcpNo=20260730000042
    • https://dart.fss.or.kr/dsaf001/main.do?rcpNo=20260720800314
    • https://dart.fss.or.kr/dsaf001/main.do?rcpNo=20260810800065
    • https://www.thefairnews.co.kr/news/articleView.html?idxno=86229
    • https://blog.naver.com/timeline_000/224390967420
    • https://blog.naver.com/newmoney2026/224390933799
    • https://www.job-post.co.kr/news/articleView.html?idxno=225173
    • https://blog.naver.com/osg9977/224390540771
    • https://blog.naver.com/hehenews/224390121455
    • https://blog.naver.com/moneymoment/224391337396

    This article explains company filings and published figures for information only. It is not investment advice or a recommendation to buy or sell any security. Figures can change after publication — check the original filings before making decisions.